Technical analysis is a method used to evaluate and predict the future price movements of securities by analyzing historical market data, primarily price and volume. Here’s a comprehensive guide on how to use technical analysis to improve your investment decisions:
1. Understanding the Basics of Technical Analysis
a. Price Charts
- Line Charts: Simplest form, showing the closing prices over a period.
- Bar Charts: Display opening, high, low, and closing prices.
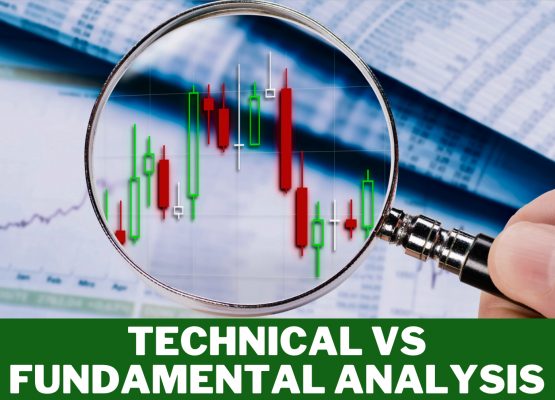
- Candlestick Charts: Provide the same information as bar charts but in a more visual and easier-to-read format.
b. Timeframes
- Choose the right timeframe based on your trading strategy (e.g., intraday, daily, weekly).
2. Key Principles of Technical Analysis
a. Trends
- Uptrend: Higher highs and higher lows.
- Downtrend: Lower highs and lower lows.
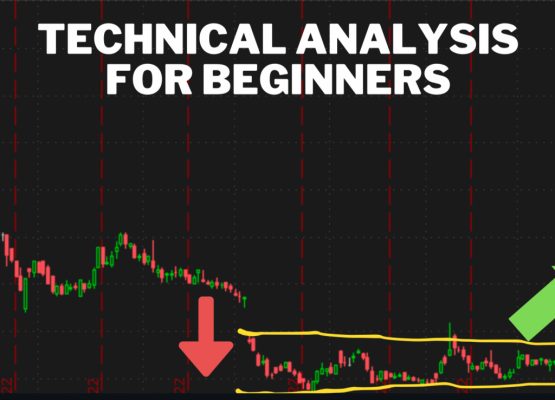
- Sideways/Range-bound: Price moves within a horizontal range.
b. Support and Resistance
- Support: A price level where a downtrend can be expected to pause due to a concentration of buying interest.
- Resistance: A price level where an uptrend can be expected to pause due to a concentration of selling interest.
c. Volume
- Indicates the number of shares traded.
- High volume often accompanies strong price moves.
3. Common Technical Indicators
a. Moving Averages
- Simple Moving Average (SMA): Average price over a specific period.
- Exponential Moving Average (EMA): Gives more weight to recent prices.
b. Relative Strength Index (RSI)
- Measures the speed and change of price movements.
- Values range from 0 to 100; typically, overbought conditions are above 70, and oversold conditions are below 30.
c. Moving Average Convergence Divergence (MACD)
- Shows the relationship between two moving averages of a security’s price.
- Consists of the MACD line, the signal line, and a histogram.
d. Bollinger Bands
- Consist of a middle band (SMA) and two outer bands (standard deviations away from the SMA).
- Used to measure market volatility.
e. Stochastic Oscillator
- Compares a particular closing price of a security to a range of its prices over a certain period.
- Values range from 0 to 100; typically, values above 80 are considered overbought, and values below 20 are considered oversold.
4. Chart Patterns
a. Continuation Patterns
- Triangles: Symmetrical, ascending, or descending triangles.
- Flags and Pennants: Short-term continuation patterns.
b. Reversal Patterns
- Head and Shoulders: Indicates a potential reversal of an uptrend.
- Double Tops and Bottoms: Indicates a potential reversal of the current trend.
5. Developing a Trading Strategy
a. Define Your Goals
- Determine your investment objectives and risk tolerance.
b. Choose Your Indicators
- Select a combination of indicators that complement each other (e.g., combining a trend-following indicator like MACD with an oscillator like RSI).
c. Entry and Exit Points
- Use technical analysis to identify optimal entry and exit points based on your chosen indicators and patterns.
d. Risk Management
- Set stop-loss orders to limit potential losses.
- Determine your position size based on your risk tolerance.
6. Practice and Backtesting
a. Backtesting
- Test your strategy on historical data to see how it would have performed.
b. Paper Trading
- Practice your strategy in a simulated environment without risking real money.
7. Continuous Learning and Adaptation
a. Keep Up with Market Changes
- Stay updated with market news and events that could impact your investments.
b. Review and Adjust
- Regularly review your strategy’s performance and make necessary adjustments.
Conclusion
Technical analysis can be a powerful tool for making better investment decisions when used correctly. By understanding the principles, learning how to read charts and indicators, and developing a disciplined trading strategy, you can enhance your ability to predict market movements and make informed investment choices. Remember, no strategy guarantees success, so always manage your risks and stay informed.