
Day Trading

Day Trading for Beginners – 6 Tips for Making Money Day Trading Stocks
Day trading is a trading strategy in which traders buy and sell financial assets (such as stocks, currencies, commodities, or derivatives) within a single trading day. The goal of day trading is to profit from short-term price movements in the market. Day traders rely on technical analysis, chart patterns, and other technical indicators to identify […]

Technical vs. Fundamental Analysis – Which is More Important?
As an investor or trader, your aim is to make decisions that will help you achieve profitable returns. To do this, you must understand and analyze a plethora of market variables and indicators. Two popular analysis strategies employed are Technical Analysis and Fundamental Analysis. This article will explore these strategies in-depth, their relevance for specific […]

The Absolute Worst Time to Buy a Stock (Avoid this Big Mistake)
If there’s one lesson every investor must learn, it is that stock markets are a veritable mix of cold, hard facts and emotion-driven speculation. Fear and greed, in particular, often take the reins, shaping market trends and driving investor behavior in ways that can be destructive to their financial health. There are many instances when […]
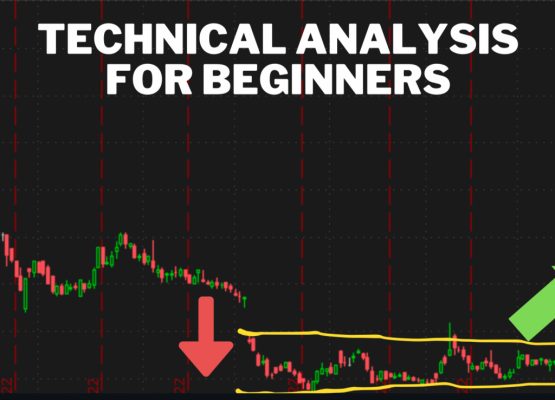
What is Technical Analysis? Top 5 Technical Analysis Indicators for Beginners
Technical analysis is a method used to evaluate securities such as stocks, currencies, and commodities by analyzing statistics generated by market activity, such as price and volume. It involves using charts and other technical indicators to identify patterns and trends that can be used to predict future price movements. Technical analysts believe that all […]